Pro Features
Sheets Market Data also comes with a Pro plan for those who want to dig deeper into the data. The Pro features include:
- Data Range
- Historical Data
- Analysis Data
- Time Series Data
- Income Statement Data
- Balance Sheet Data
- Cash Flow Statement Data
- Earnings Data
- Options Data
Note
In order to use the Pro Features, you will have to subscribe to the Pro Plan and setup your license key. For more on how to do that, click here.
Data Range
The Pro features give you the ability to pass a range of symbols or data to any of our functions (except time series), instead of having to just pass in one at a time. This makes it significantly easier to deal with large spreadsheets of data. It also has the added benefit of reducing the likelihood that you bump up against Google’s quota limits.
All you have to do to use this feature is instead of passing in a string value (i.e. "GOOG") or a single cell reference (i.e. A1) for a stock or data argument in our custom functions, you can use a range of cells (i.e. A1:A25). This includes the custom functions outlined in Basic Features as well as all of the functions included below.
Note: you cannot pass a range of data to the sheet generating menu scripts, only to our spreadsheet functions.
How to Use Data Ranges (Video)
Analysis Data
To get analysis data for a particular stock, use the function:
=ANALYSIS_DATA(symbol(s), type, data, timePeriod)
This function takes four arguments. What arguments are required depends on the type of data you want. For instance, if you would like growth estimate data, then only the type and symbol are required. For all other types of data (see list below), the symbol, type, and data arguments are required.
The first argument is the symbol of the stock(s) you want data for—as either a string, a cell reference, or a range of cells. The second argument is the category of type of analysis data you would like—as either a string or a cell reference. The next argument is for the type of data you would like within a category or type—as either a string, cell reference or a range of cells. This argument is optional and ignored if you use “growthEstimate” as the type argument, otherwise it is required. The last argument in this formula is for the specific time period you would like the data for (see list of options below)—as either a string or a cell reference—it is not required. If it is not given, it will use the current quarter (“0q”) as the time period.
Below is a full list of each argument option and what data it refers to.
List of type arguments
growthEstimate- Analysts’ Growth EstimatesearningsEstimate- Analysts’ Earnings EstimatesrevenueEstimate- Analysts’ Revenue EstimatesepsTrend- EPS TrendsepsRevisions- EPS Revisions
List of data arguments by type
growthEstimate
None
earningsEstimate
numberOfAnalysts- Number of Analysts’ Estimatesavg- Average Estimatelow- Low Estimatehigh- High EstimateyearAgoEps- Last year’s EPSgrowth- Growth of Earnings Estimate
revenueEstimate
numberOfAnalysts- Number of Analysts’ Estimatesavg- Average Estimatelow- Low Estimatehigh- High EstimateyearAgoRevenue- Last year’s Revenuegrowth- Growth of Revenue Estimate
epsTrend
current- Current Estimate7daysAgo- 7 Days Ago Estimate30daysAgo- 30 Days Ago Estimate60daysAgo- 60 Days Ago Estimate90daysAgo- 90 Days Ago Estimate
epsRevisions
upLast7days- Up Last 7 DaysupLast30days- Up Last 30 DaysdownLast7days- Down Last 7 DaysdownLast30days- Down Last 30 DaysdownLast90days- Down Last 90 Days
List of timePeriod arguments by type
0q- Current Quarter (default)+1q- Next Quarter0y- Current Year+1y- Next Year
The following are only available for growthEstimate:
+5y- Next 5 Years (per annum)-5y- Previous 5 Years (per annum)
Historical Data
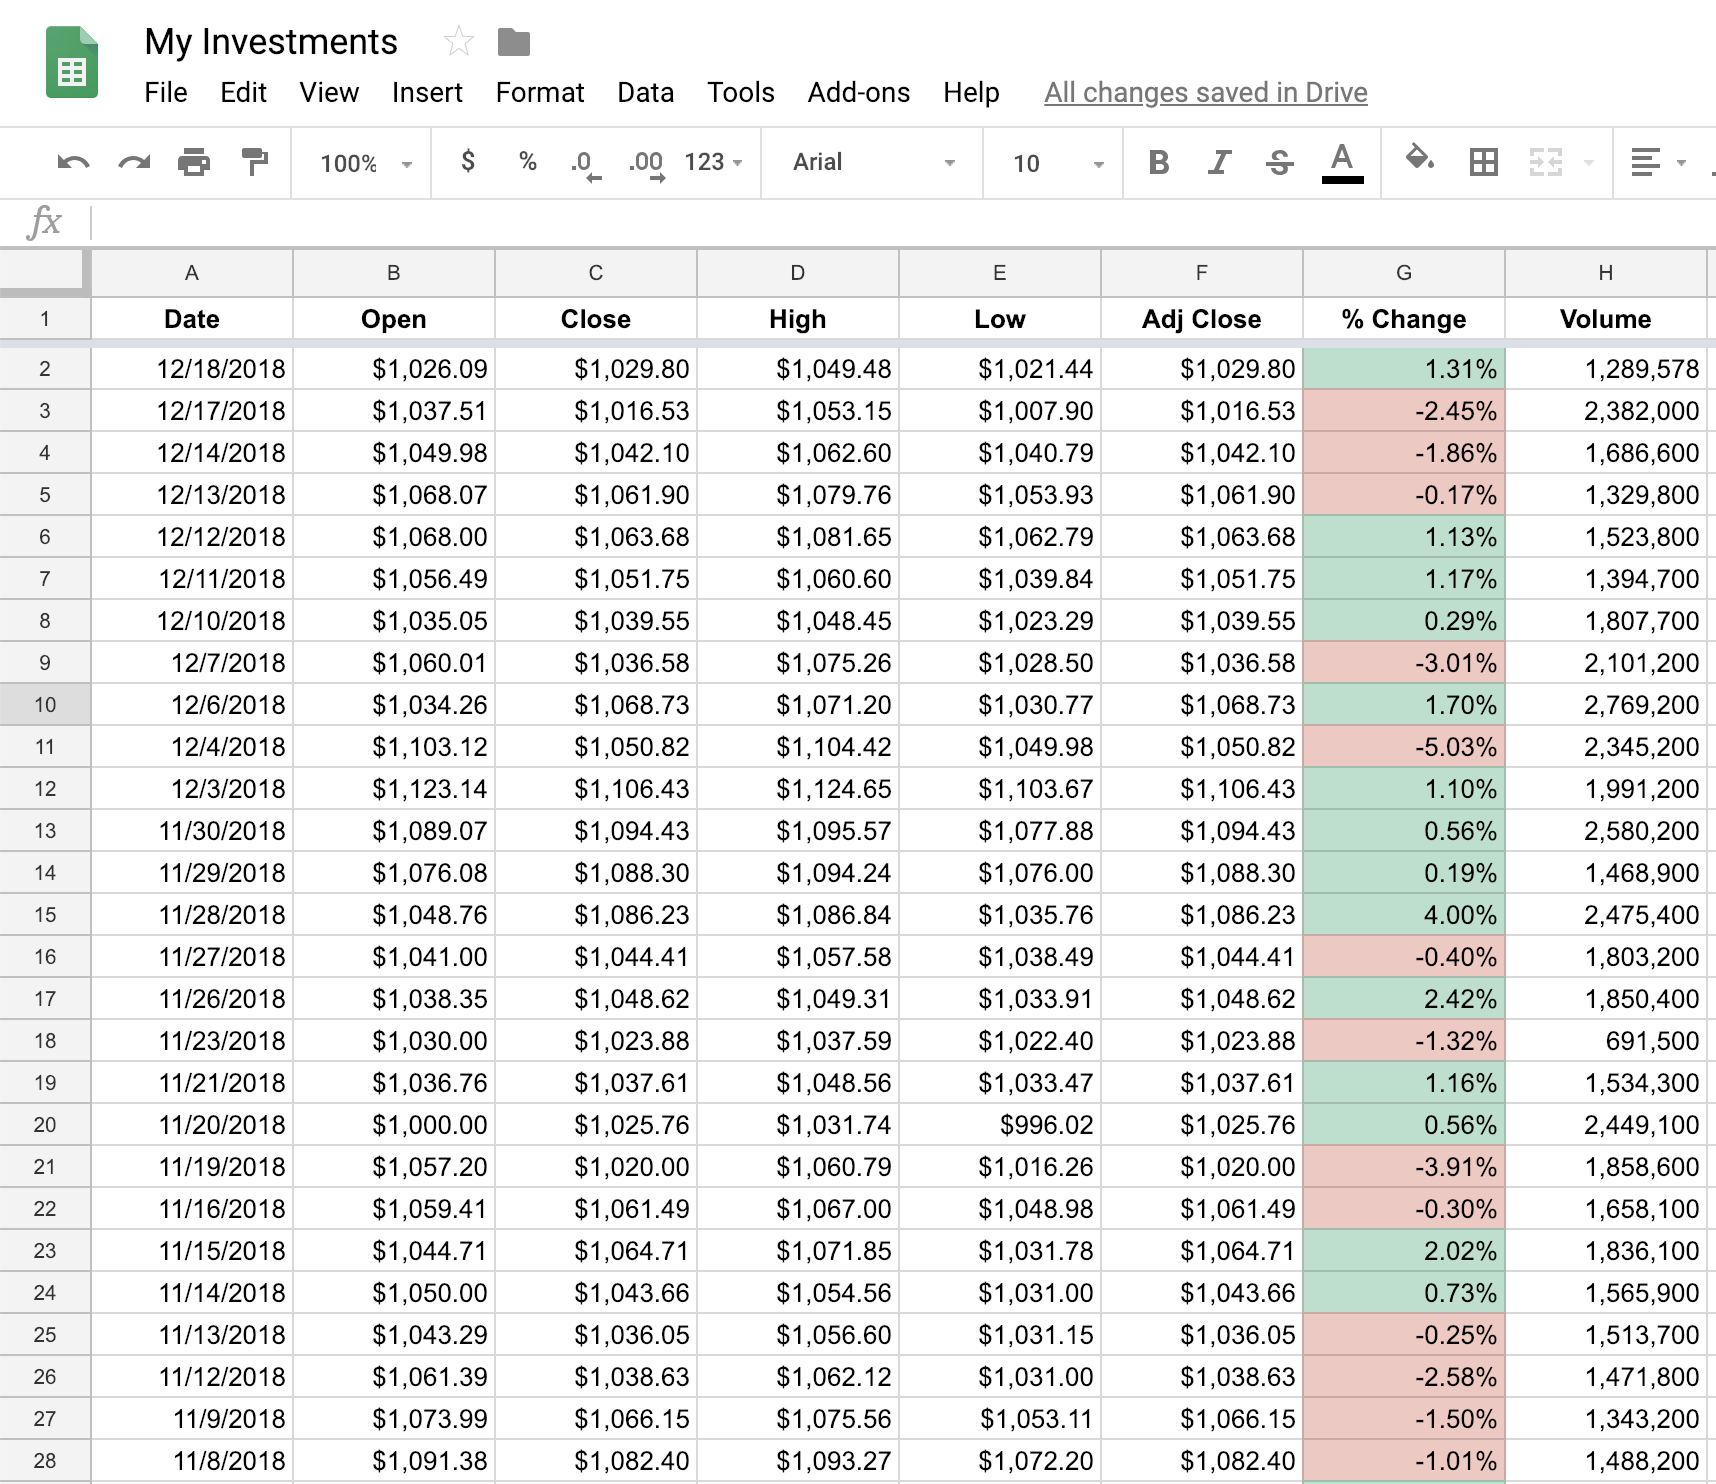
Sheets Market Data Pro allows you to pull historical data into your spreadsheets in a few different ways. The first way is by creating separate historical data sheets. These sheets can be generated automatically by simply providing a stock’s symbol. The generated sheet includes Date, Open, High, Low, Close, Adj Close, % Change, Volume, and Dividend as far back as data is available–for some stocks as far back as 1970.
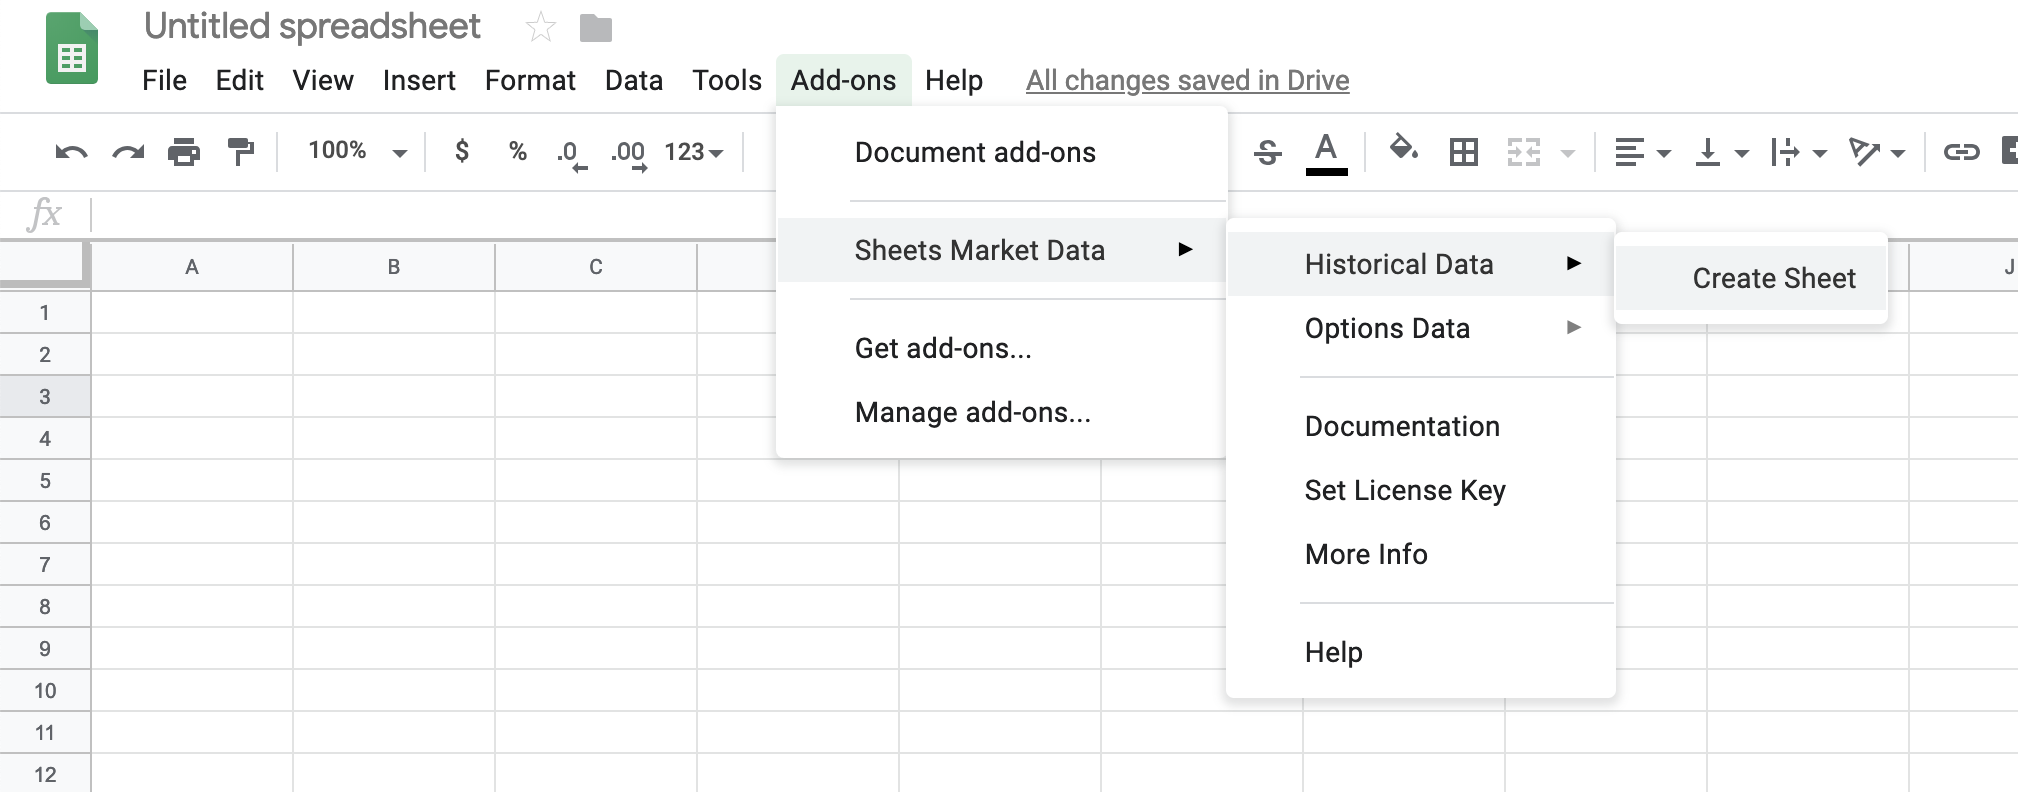
Generating a historical data sheet is simple. First, navigate to Add-ons > Sheets Market Data > Historical Data > Create Sheet(s).
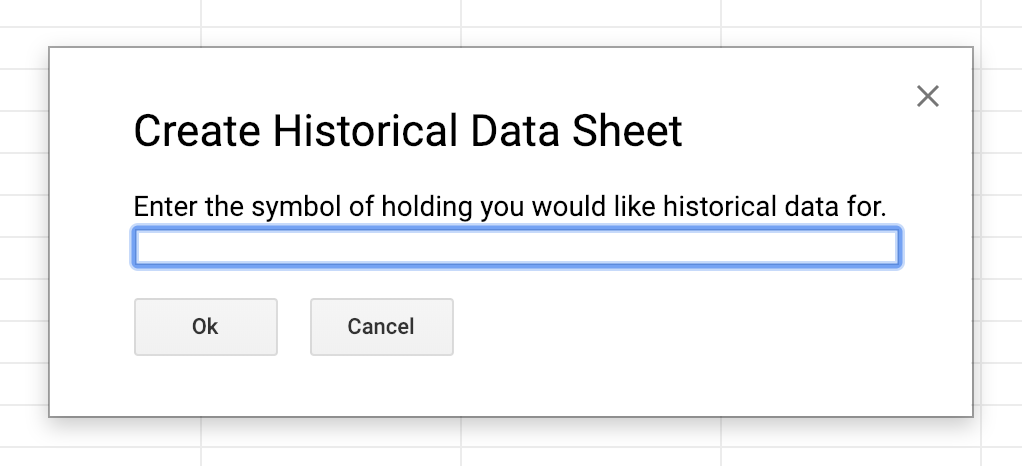
This will open a dialog box asking you to enter the symbol of the stock you would like historical data for. Enter the symbol of the stock you would like this data for and click Ok. If you would like to generate multiple sheets at once, separate each symbol you want historical data for with a comma.
This will run the script which will generate a new sheet with all the historical data for the given stock. You are now free to use the data however you see fit. The sheet will auto-update each time you open your spreadsheet with the latest information for you if you leave it in your spreadsheet.
Note: because of Google imposed limits, only 20 sheets will be allowed to auto-generate per spreadsheet.
Another way that Sheets Market Data Pro allows you to use historical data in your spreadsheets is through the below data functions.
Time Series Data
Don’t want to generate an entire sheet of historical data? Then use our time series data function. With this function, you can specify exact historical dates you would like data for.
=STOCK_TIME_SERIES_DATA(symbol(s), data, start, end, interval, order)
This function takes up to six arguments, two of which are required. The first is the symbol of the stock(s) you want data for—as either a string, a cell reference, or a range of cells. The second is the type of data you want—as either a string, cell reference, or range of cells. Both of these are required.
The next three arguments deal with the timeframe you would like the data. The first of these is the start date—the date you would like the data to start from. If this argument is not provided, then it will use the farthest date in which there is data. The next is the end date—the last date you would like the data for. If this is not provided, the current date will be used. The last argument is the interval for which you would like the data for—1 day, 5 days, etc. If this argument is not provided, a 1 day interval will be used.
Note: The dates should be a string in the following format: M/D/YYYY. If you provide the exact same date for both start and end, then only the data will be returned. For all other cases, the results of the function will automatically include the date.
Finally, the last argument, order, deals with the order you would like the data to be listed in. This argument can be either asc (for ascending order, where the oldest date is first) or desc (for descending order, where the most recent date is first). It should be in a string format using double quotes “”. If this argument is not supplied, it defaults to descending order.
Below is a full list of every available option and what data it refers to.
List of data arguments
open- Openhigh- Highlow- Lowclose- Closeadjclose- Adjusted Closevolume- Volumedividend- Dividend
List of interval arguments
1d- 1 day5d- 5 days1wk- 1 week1mo- 1 month3mo- 3 months
List of order arguments
asc- Ascending order (oldest date first)desc- Descending order (most recent date first)
Income Statements
To get a stock’s annual Income Statement data, use the function:
=INCOME_STATEMENT_DATA(symbol(s), data, year)
This function takes three arguments, two of which are required. The first is the symbol of the stock(s) you want data for—as either a string, a cell reference, or a range of cells. The second is the type of data you want—as either a string, cell reference, or range of cells. Both of these are required. The last argument is the year you would like data for. This last option is optional and if you do not enter a year then it will default to the latest year data is available.
Note: historical Income Statement data go back 4 years. Also, the years correspond with the year a company’s financial year ends.
Below is a full list of every available option and what data it refers to.
List of data arguments
endDate- Period Ending DatetotalRevenue- Total RevenuecostOfRevenue- Cost of RevenuegrossProfit- Gross ProfitresearchDevelopment- Research and DevelopmentsellingGeneralAdministrative- Selling General and AdministrativenonRecurring- Non RecurringotherOperatingExpenses- OtherstotalOperatingExpenses- Total Operating ExpensesoperatingIncome- Operating Income or LosstotalOtherIncomeExpenseNet- Total Other Income/Expenses Netebit- Earnings Before Interest and TaxesinterestExpense- Interest ExpenseincomeBeforeTax- Income Before TaxincomeTaxExpense- Income Tax ExpenseminorityInterest- Minority InterestnetIncomeFromContinuingOps- Net Income From Continuing OpsdiscontinuedOperations- Discontinued OperationsextraordinaryItems- Extraordinary ItemseffectOfAccountingCharges- Effect Of Accounting ChangesotherItems- Other ItemsnetIncome- Net IncomenetIncomeApplicableToCommonShares- Net Income Applicable To Common Shares
Balance Sheets
To get a stock’s annual Balance Sheet data, use the function:
=BALANCE_SHEET_DATA(symbol(s), data, year)
This function takes three arguments, two of which are required. The first is the symbol of the stock(s) you want data for—as either a string, a cell reference, or a range of cells. The second is the type of data you want—as either a string, cell reference, or range of cells. Both of these are required. The last argument is the year you would like data for. This last option is optional and if you do not enter a year then it will default to the latest year data is available.
Note: historical Balance Sheet data go back 4 years. Also, the years correspond with the year a company’s financial year ends.
Below is a full list of every available option and what data it refers to.
List of data arguments
endDate- Period Ending Datecash- Cash And Cash EquivalentsshortTermInvestments- Short Term InvestmentsnetReceivables- Net ReceivablesotherCurrentAssets- Other Current AssetstotalCurrentAssets- Total Current AssetslongTermInvestments- Long Term InvestmentspropertyPlantEquipment- Property Plant and EquipmentgoodWill- GoodwillintangibleAssets- Intangible AssetsotherAssets- Other AssetsdeferredLongTermAssetCharges- Deferred Long Term Asset ChargestotalAssets- Total AssetsaccountsPayable- Accounts PayableotherCurrentLiab- Other Current LiabilitieslongTermDebt- Long Term DebtotherLiab- Other LiabilitiestotalCurrentLiabilities- Total Current LiabilitiestotalLiab- Total LiabilitiescommonStock- Common StockretainedEarnings- Retained EarningstreasuryStock- Treasury StockcapitalSurplus- Capital SurplusotherStockholderEquity- Other Stockholder EquitytotalStockholderEquity- Total Stockholder EquitynetTangibleAssets- Net Tangible Assets
Cash Flow Statements
To get a stock’s annual Cash Flow Statement data, use the function:
=CASH_FLOW_STATEMENT_DATA(symbol(s), data, year)
This function takes three arguments, two of which are required. The first is the symbol of the stock(s) you want data for—as either a string, a cell reference, or a range of cells. The second is the type of data you want—as either a string, cell reference, or range of cells. Both of these are required. The last argument is the year you would like data for. This last option is optional and if you do not enter a year then it will default to the latest year data is available.
Note: historical Cash Flow Statement data go back 4 years. Also, the years correspond with the year a company’s financial year ends.
Below is a full list of every available option and what data it refers to.
List of data arguments
endDate- Period Ending DatenetIncome- Net Incomedepreciation- DepreciationchangeToNetincome- Adjustments To Net IncomechangeToLiabilities- Changes In LiabilitieschangeToOperatingActivities- Changes In Other Operating ActivitiestotalCashFromOperatingActivities- Total Cash Flow From Operating ActivitiescapitalExpenditures- Capital Expendituresinvestments- InvestmentsotherCashflowsFromInvestingActivities- Other Cash flows from Investing ActivitiestotalCashflowsFromInvestingActivities- Total Cash Flows From Investing ActivitiesdividendsPaid- Dividends PaidnetBorrowings- Net BorrowingsotherCashflowsFromFinancngActivities- Other Cash Flows from Financing ActivitiestotalCashFromFinanciingActivities- Total Cash Flows From Financing ActivitieseffectOfExchangeRate- Effect Of Exchange Rate ChangeschangeInCash- Change In Cash and Cash Equivalents
Earnings
To get a stock’s Earnings data for the last year, use the function:
=EARNINGS_DATA(symbol(s), data, quarter)
This function takes three arguments, two of which are required. The first is the symbol of the stock(s) you want data for—as either a string, a cell reference, or a range of cells. The second is the type of data you want—as either a string, cell reference, or range of cells. Both of these are required. The last argument is the quarter you would like data for. This last option is optional and if you do not enter a quarter then it will default to the latest quarter data is available.
Note: historical Earnings data go back 1 year (last 4 quarters). Also, the quarter argument expects the format 1Q2018.
Below is a full list of every available option and what data it refers to.
List of data arguments
actual- Actual earnings per shareestimate- Estimate earnings per share
Options Data
Sheets Market Data Pro allows you to pull options data into your spreadsheets in two ways. The first way is by generating a separate data sheet. The other way is by using a custom options function.
Options Video Overview
Options Data Sheet
The Sheets Market Data add-on can generate an option data sheet for you in just a click of the mouse.
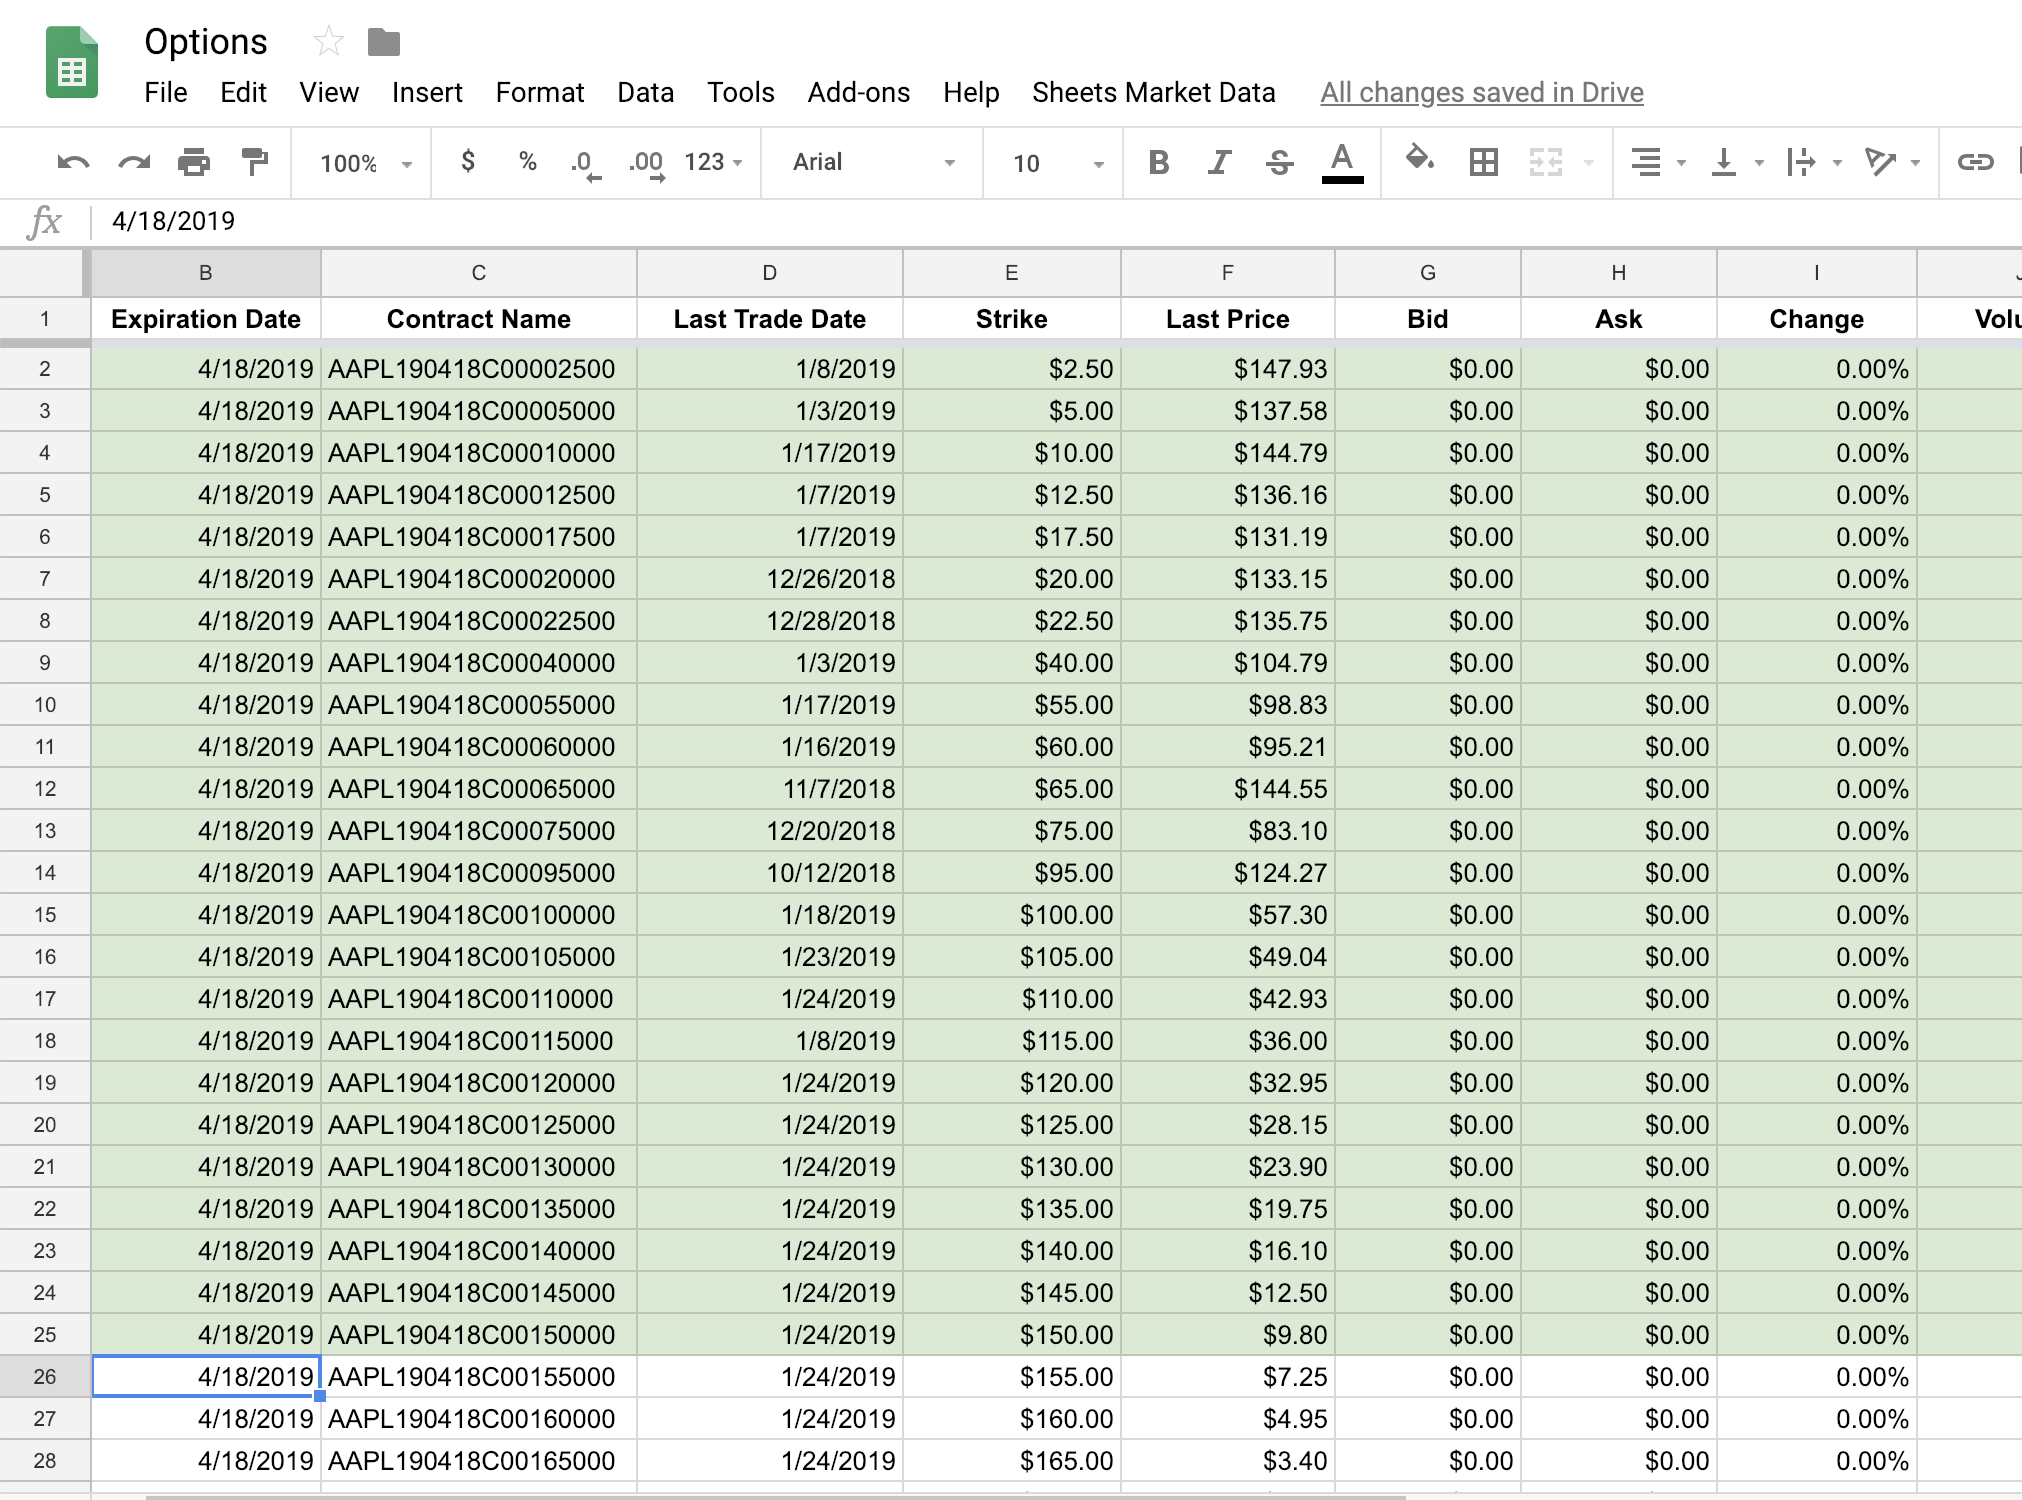
The sheet is generated automatically just by providing the symbol of the underlying stock for an option. The generated sheet will include all option contracts for that stock with future expiration dates (both calls and puts) and put them in a new sheet with columns for:
- Type
- Expiration Date
- Contract Name
- Last Trade Date
- Strike
- Last Price
- Bid
- Ask
- Change
- Volume
- Open Interest
- Implied Volatility
- In the Money
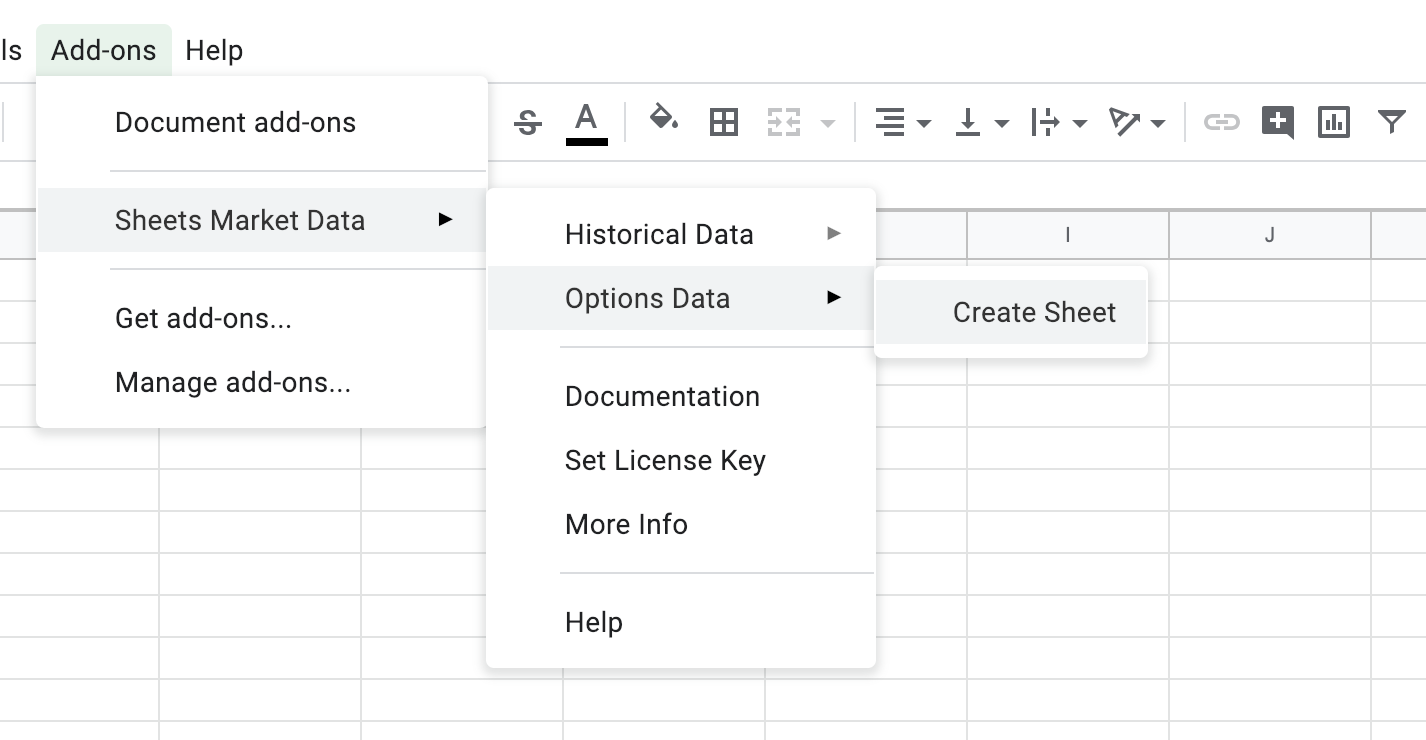
Generating an options data sheet is simple. First, navigate to Add-ons > Sheets Market Data > Options Data > Create Sheet(s).
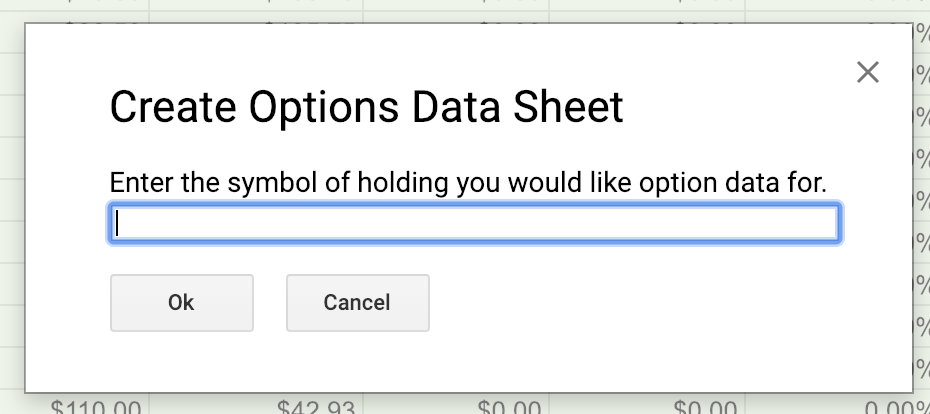
This will open a dialog box asking you to enter the symbol of the underlying stock of the option you would like data for. Enter the symbol of the stock you would like this data for and click Ok. If you would like to generate multiple sheets at once, separate each symbol you want historical data for with a comma.
This will run the script which will generate a new sheet with all the options data for the given stock. You are now free to use the data however you see fit. The sheet will auto-update each time you open your spreadsheet with the latest information for you if you leave it in your spreadsheet.
Options Data Function
To get data for a specific options contract, use the function:
=OPTIONS_DATA(symbol(s), data)
This function takes two arguments. The first is the symbol(s) of the option contract you want data for—as either a string, a cell reference, or a range of cells. The second is the type of data you want—as either a string, cell reference, or range of cells. Both of these arguments are required.
Note: if you don’t know what the symbol is for a specific option contract you’re interested in, try finding some by generating an option data sheet as explained above.
Below is a full list of every available data argument and what it refers to.
List of data arguments
strike- Strike priceunderlyingSymbol- Symbol of the underlying stock this option is foropenInterest- Open InterestexpireDate- Expiration Dateexchange- Exchange option is traded onask- Ask pricebid- Bid priceregularMarketPrice- Current option priceregularMarketChange- Change in price, rawregularMarketChangePercent- Change in price, as %regularMarketOpen- Most recent market open priceregularMarketDayHigh- Most recent market day highregularMarketDayLow- Most recent market day lowregularMarketVolume- Most recent market day volumeregularMarketDayRange- Most recent market day price rangeregularMarketPreviousClose- Previous market day closefiftyTwoWeekRange- 52 week price rangefiftyTwoWeekLow- 52 week lowfiftyTwoWeekHigh- 52 week highfiftyTwoWeekLowChange- 52 week low change, rawfiftyTwoWeekLowChangePercent- 52 week low change, as %fiftyTwoWeekHighChange- 52 week high change, rawfiftyTwoWeekHighChangePercent- 52 week high change, as %